
The Create Streets team were delighted to recently attend the launch of the new Colouring London platform and support the fantastic work of Polly Hudson in partnership with University College London. Colouring London is a free website designed by University College London that collects, collates, visualises and allows people to download statistical data about every building in London.
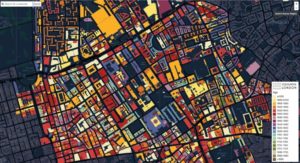
The colourful and easy-to-use visual interface (shown above) is built to enable members of the public to contribute data about buildings in London. Contributors are asked to volunteer information across any of the 12 different categories:- location, age, land-use, type, size & shape, construction methods and materials, who built and designed it, energy performance, streetscape, whether a public asset, whether a listed or other special planning category, and whether the building is ‘liked’. Volunteers of all ages and abilities, and from all sectors and disciplines, are encouraged to join the open data project and help create beautiful, colour-coded building maps.
Colouring London began life as one of the outputs of a doctoral research project at The Bartlett Centre for Advanced Spatial Analysis (CASA), UCL and was built out of a frustration at the lack of open data on UK building stock available for use in urban analysis. Inspired by open data platforms built using user contributions, such as Open Street Map and Wikipedia, CASA then set out to test the feasibility of creating a free knowledge exchange platform for the building stock of London using open data collection. Registered users are invited to contribute to the project by adding data to build an unprecedented public database of information about London’s buildings.
Colouring London has been designed to provide a simple point of access to a wide range of large-scale datasets. By assigning a colour to a range of values, such as the age of a building, Colouring London can generate maps that will allow anybody to quickly collate and view information in a way that is easily comprehensible and accessible.
The twelfth category of Colouring London data is a “Like Me?” button that allows people and communities to express their appreciation for the buildings they consider to be assets to the local built environment. “Like Me?” is envisaged as a unique tool for local planning groups and amenity societies that can be used to highlight buildings under threat where no planning application has been submitted. As more people like a building, the colour changes, creating a heatmap of London’s favourite buildings.
We look forward to using this platform in the future and encourage our readers to contribute to the database. Colouring London has launched and can be accessed here: https://colouringlondon.org/